
Published September 15, 2026 · Data through August 2026 · Methodology · Download the data (CSV)
In the year after Tropical Storm Helene, Buncombe County saw the sharpest reversal in migration of any large county in the country. Two years on, twice as many homes are for sale as before the storm, and the local workforce is smaller even though unemployment has recovered. Here is what the public data shows.
Buncombe had the steepest reversal in net domestic migration of any U.S. county with 100,000+ residents.
Change in Buncombe’s labor force, July 2024 to July 2026, even as unemployment returned to 3.4% (preliminary BLS data).
Tropical Storm Helene hit Western North Carolina on September 26–27, 2024. The U.S. Census Bureau’s Vintage 2025 population estimates, released in March 2026, were the first official county figures to cover a full year after the storm, measuring change from July 1, 2024, to July 1, 2025. They showed Buncombe County’s population fell by an estimated 1,810 people (0.6%), the largest numeric loss of any North Carolina county, while the state gained 145,907 residents.
To see how unusual Buncombe’s shift was nationally, we compared the change in net domestic migration, adjusted for population, across all 620 U.S. counties with at least 100,000 residents. Buncombe’s swing equaled 13.7 fewer net movers per 1,000 residents, the largest drop in the country. The next largest was Craighead County, Arkansas, at 12.1.
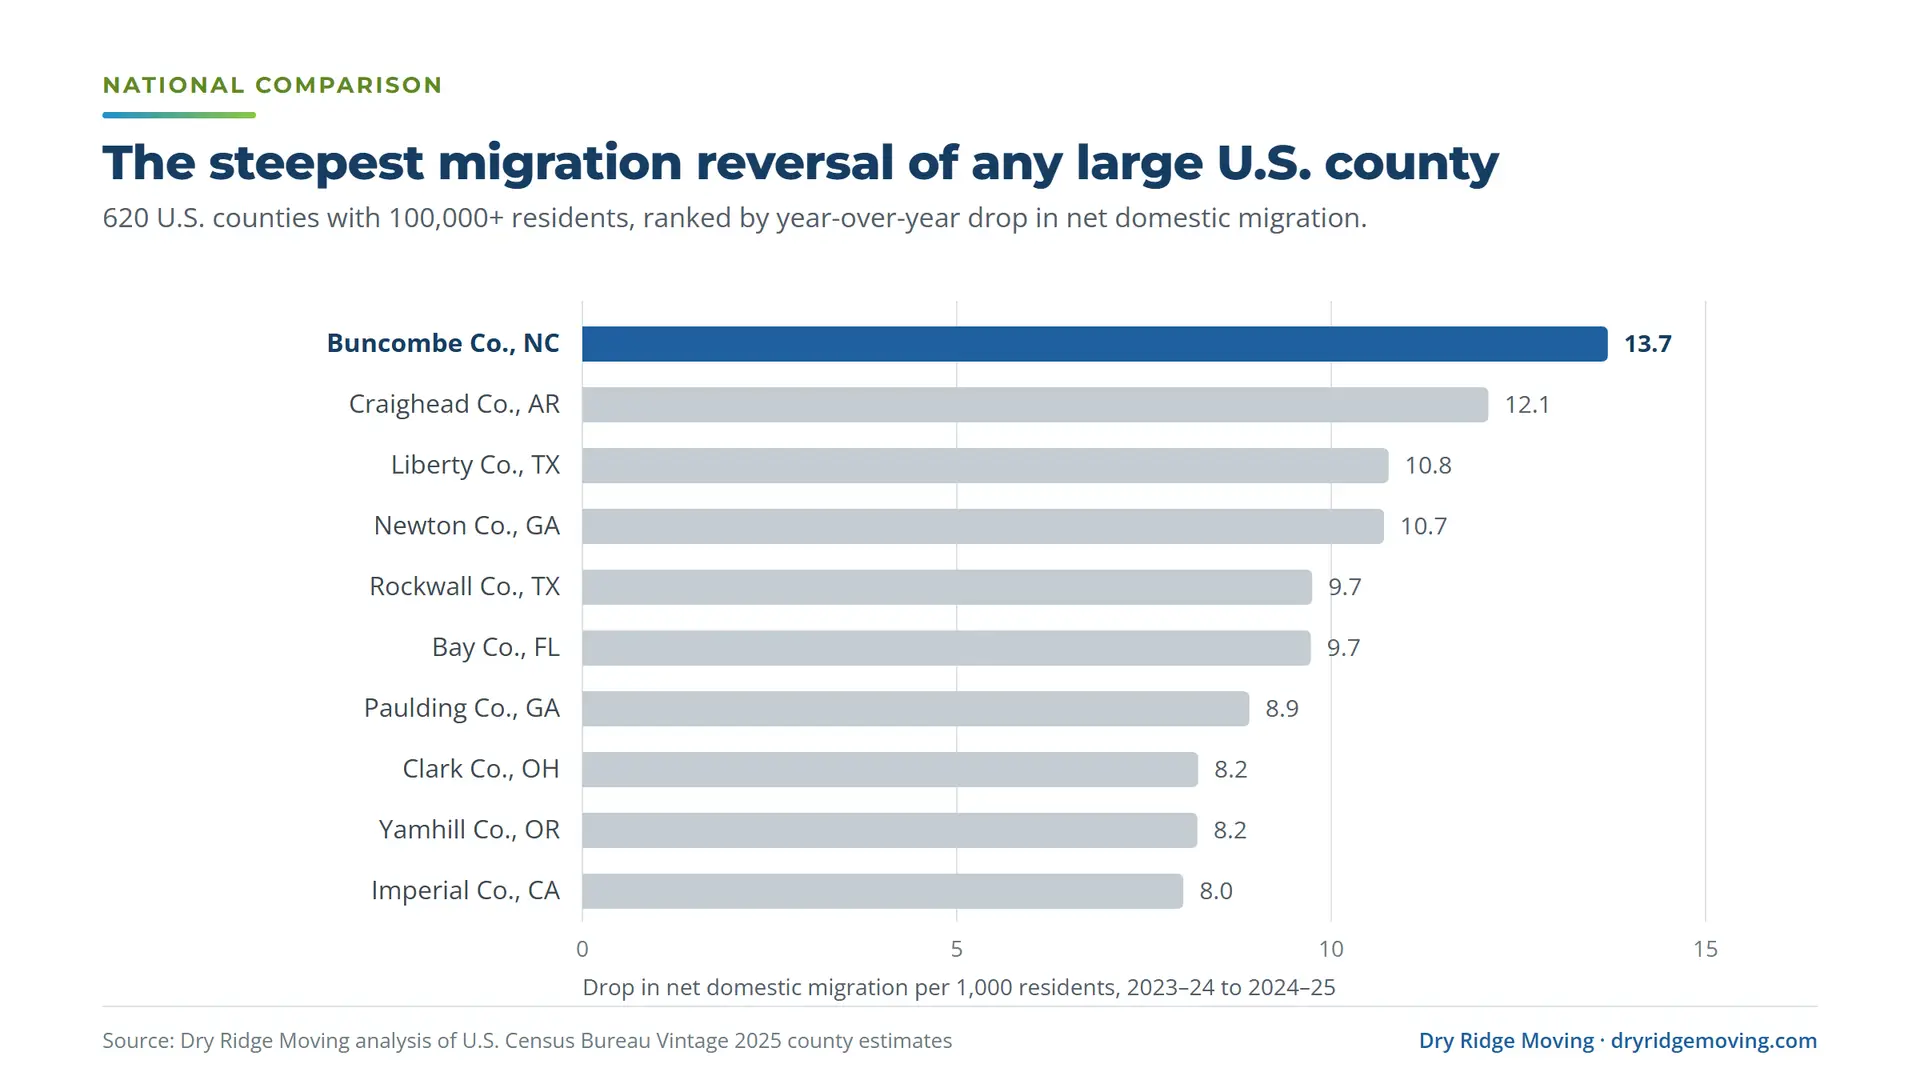
Change in net domestic migration from 2023–24 to 2024–25, divided by July 2024 population. Counties with 100,000+ residents. Download chart (PNG)
County | Change per 1,000 residents |
|---|---|
Buncombe County, North Carolina | −13.7 |
Craighead County, Arkansas | −12.1 |
Liberty County, Texas | −10.8 |
Newton County, Georgia | −10.7 |
Rockwall County, Texas | −9.7 |
Bay County, Florida | −9.7 |
Paulding County, Georgia | −8.9 |
Clark County, Ohio | −8.2 |
Yamhill County, Oregon | −8.2 |
Imperial County, California | −8.0 |
Population change has three parts: births minus deaths, international migration, and domestic migration (people moving between U.S. counties). Buncombe County already records more deaths than births each year, so its growth has depended on people moving in.
In the year before Helene, about 1,768 more people moved into Buncombe from elsewhere in the U.S. than moved out. In the year after, the balance reversed to −2,056. International migration also fell by about half, from 1,533 to 754.
The surrounding counties kept gaining movers, but at a slower pace. Henderson County’s domestic migration held nearly steady (+1,145), while Madison (+177) and Transylvania (+129) slowed sharply.
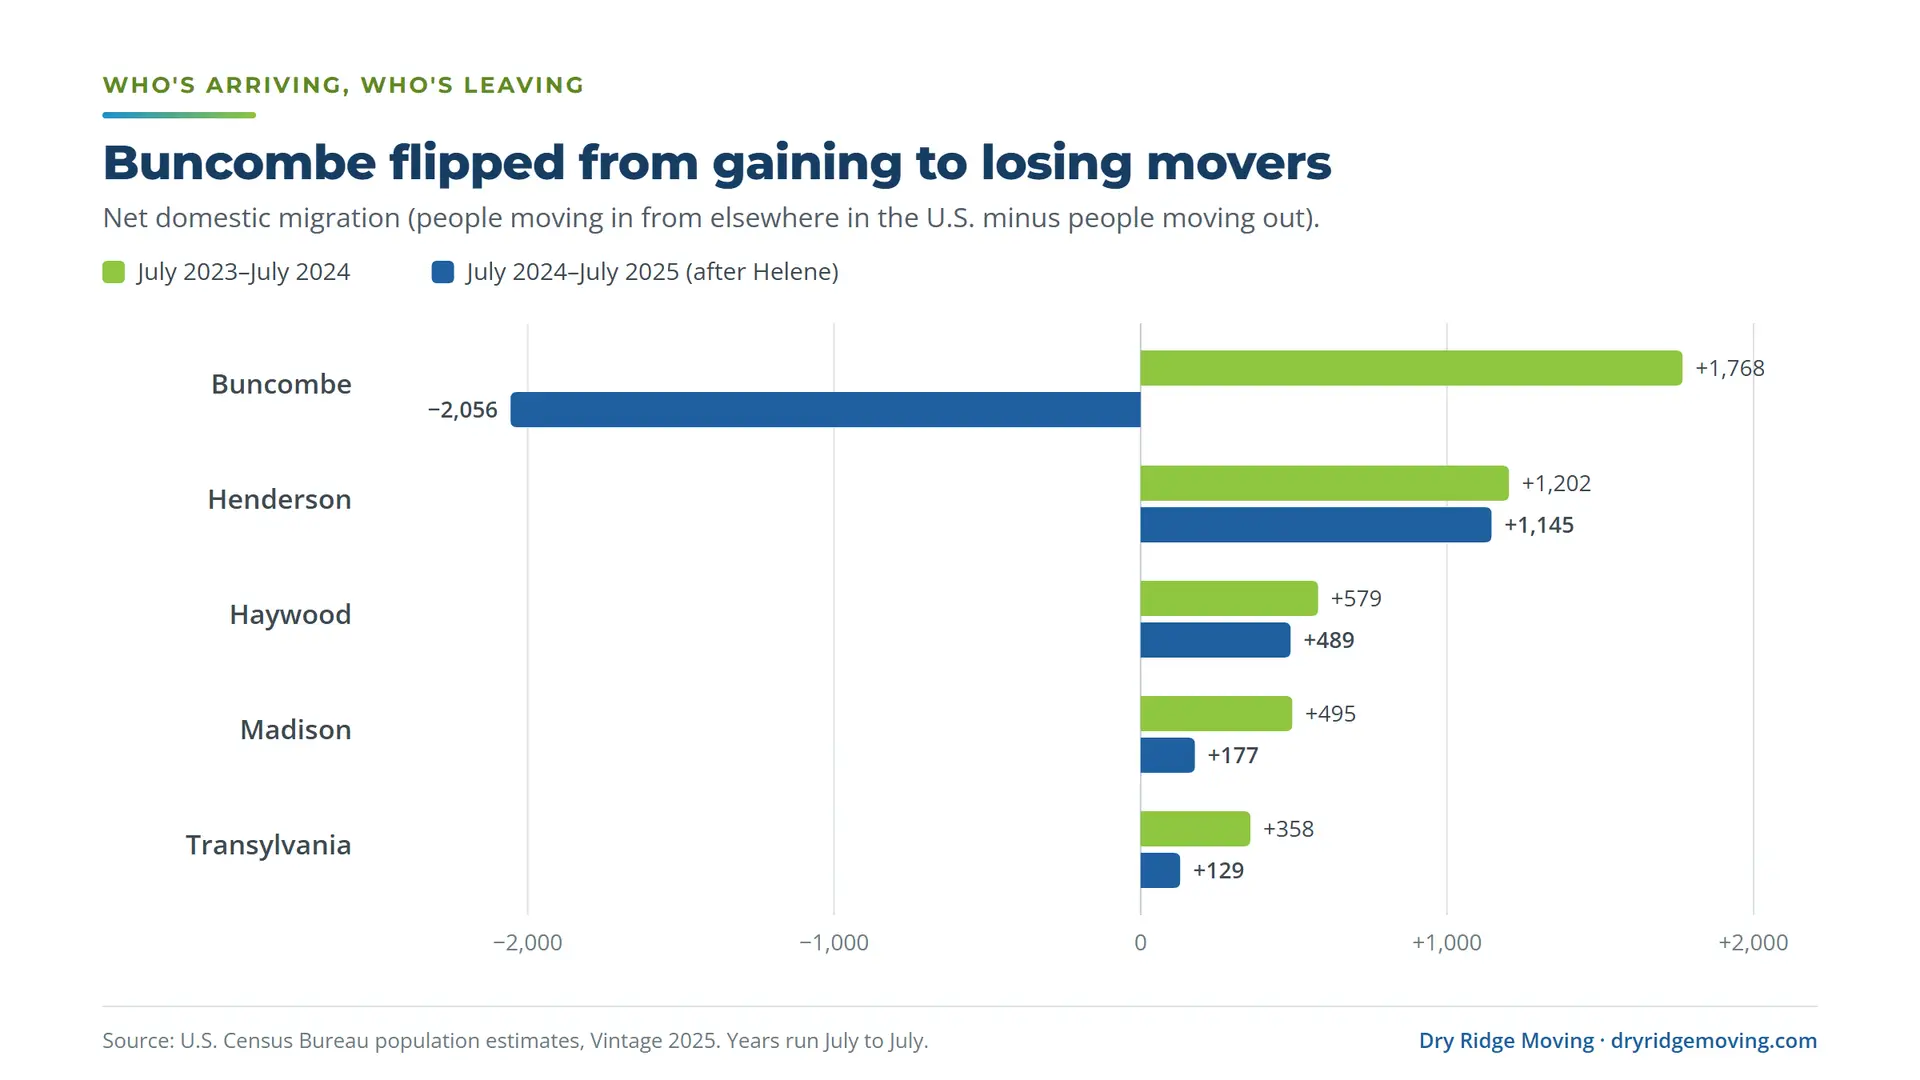
Net domestic migration by county. Positive numbers mean more people moved in from other U.S. counties than moved out. Download chart (PNG)
County | July 2023–July 2024 | July 2024–July 2025 |
|---|---|---|
Buncombe | +1,768 | −2,056 |
Haywood | +579 | +489 |
Henderson | +1,202 | +1,145 |
Madison | +495 | +177 |
Transylvania | +358 | +129 |
The reversal ended a long run of growth. Census annual estimates show Buncombe County gaining residents every year from 2000 through 2024, adding between roughly 1,400 and 4,900 people a year, before the 1,810-person drop in the year after the storm. No other North Carolina county lost as many people that year; the next-largest drop was Halifax County’s 459.
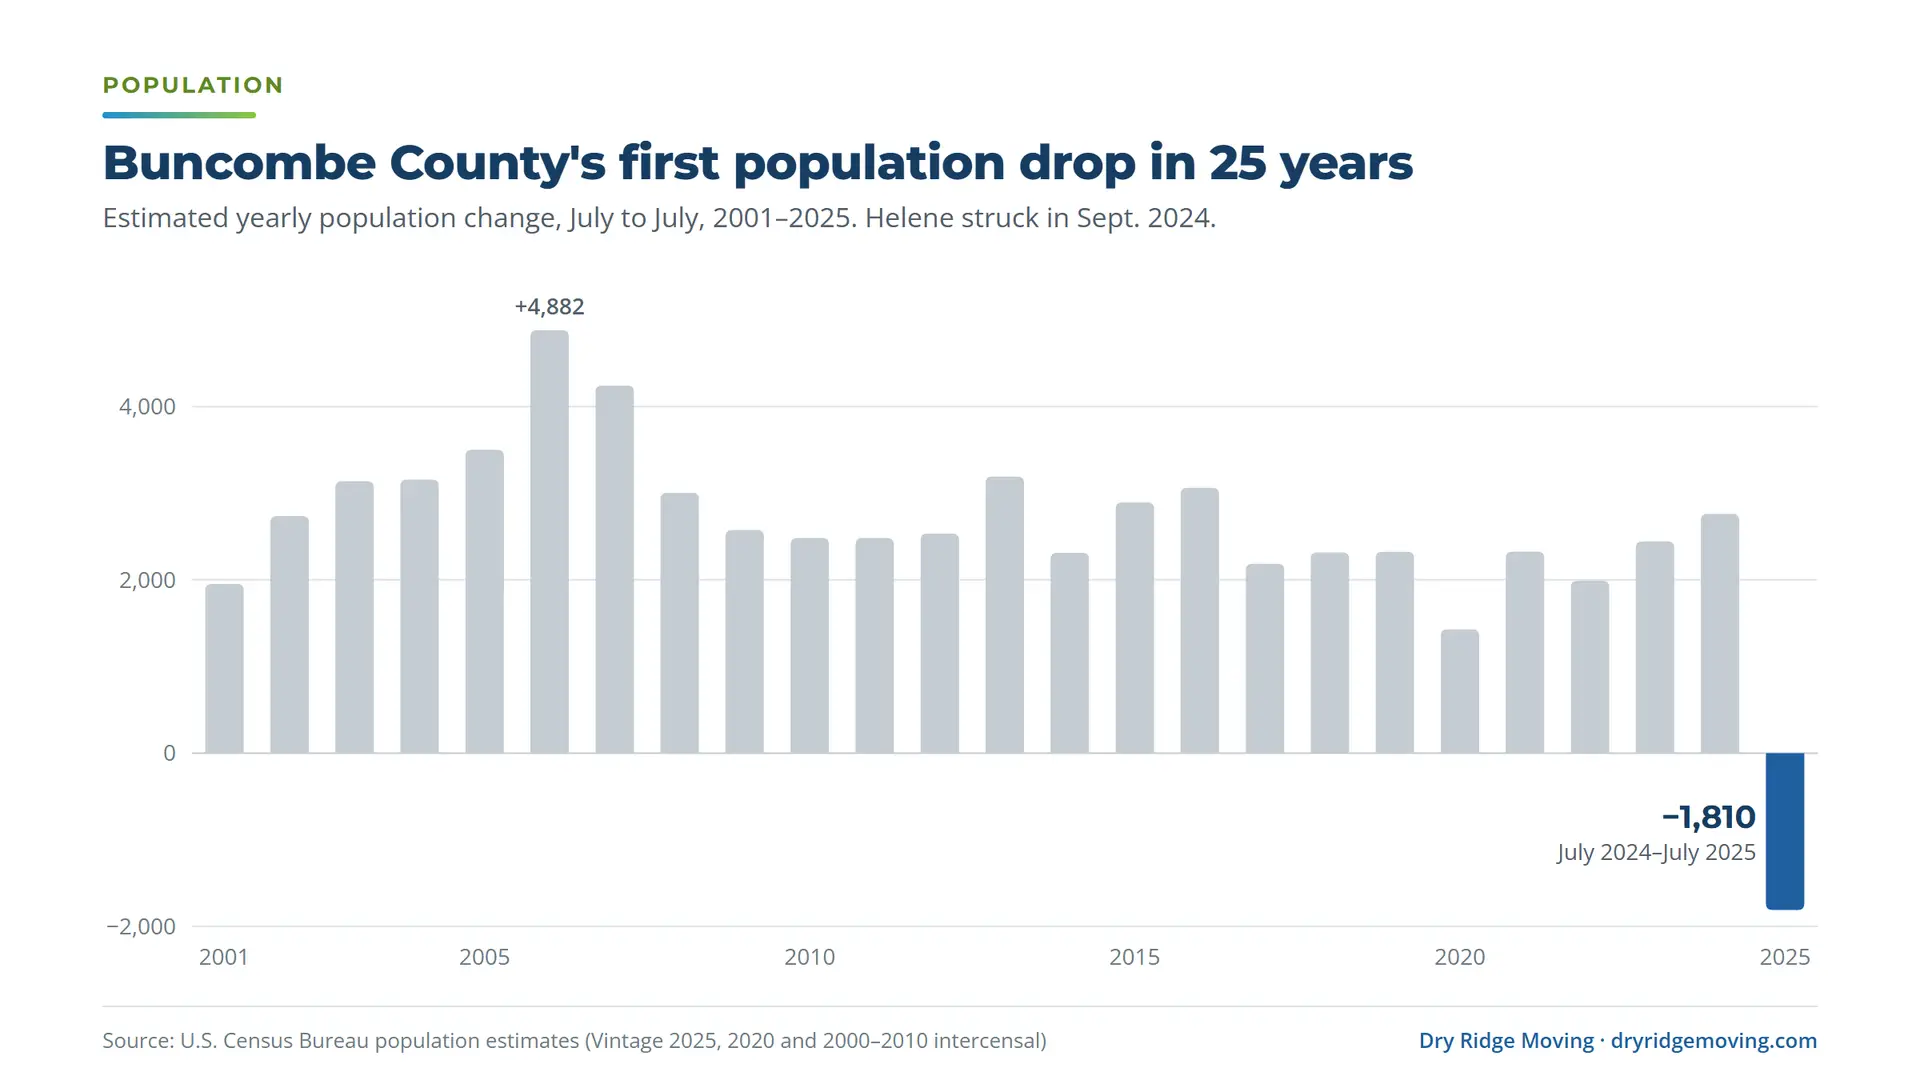
Buncombe County’s estimated annual population change. Each bar covers July 1 of the prior year to July 1 of the year shown. Download chart (PNG)
Year ending July 1 | Population change |
|---|---|
2025 | −1,810 |
2024 | +2,764 |
2023 | +2,444 |
2022 | +1,989 |
2021 | +2,327 |
2020 | +1,428 |
2019 | +2,323 |
2018 | +2,318 |
2017 | +2,186 |
2016 | +3,062 |
2015 | +2,895 |
2014 | +2,313 |
2013 | +3,191 |
2012 | +2,535 |
2011 | +2,483 |
2010 | +2,483 |
2009 | +2,577 |
2008 | +3,006 |
2007 | +4,242 |
2006 | +4,882 |
2005 | +3,503 |
2004 | +3,157 |
2003 | +3,141 |
2002 | +2,737 |
2001 | +1,952 |
The housing market tells a similar story. According to Realtor.com data published by the Federal Reserve Bank of St. Louis, Buncombe County had 886 active listings in August 2024, just before the storm. By August 2026 it had 1,799, an increase of 103%. Nationally, listings rose 25% over the same period. Henderson County’s listings rose 74%. Homes are also sitting longer. The median listing in Buncombe spent 78 days on the market in August 2026, up from 54 days in August 2024 and above the national median of 60.
Context: August 2024 inventory was low by historical standards, nationally and locally. Buncombe had 1,447 active listings in August 2019. Part of the rise is a return toward pre-pandemic levels; the rest outpaces the national rebound.
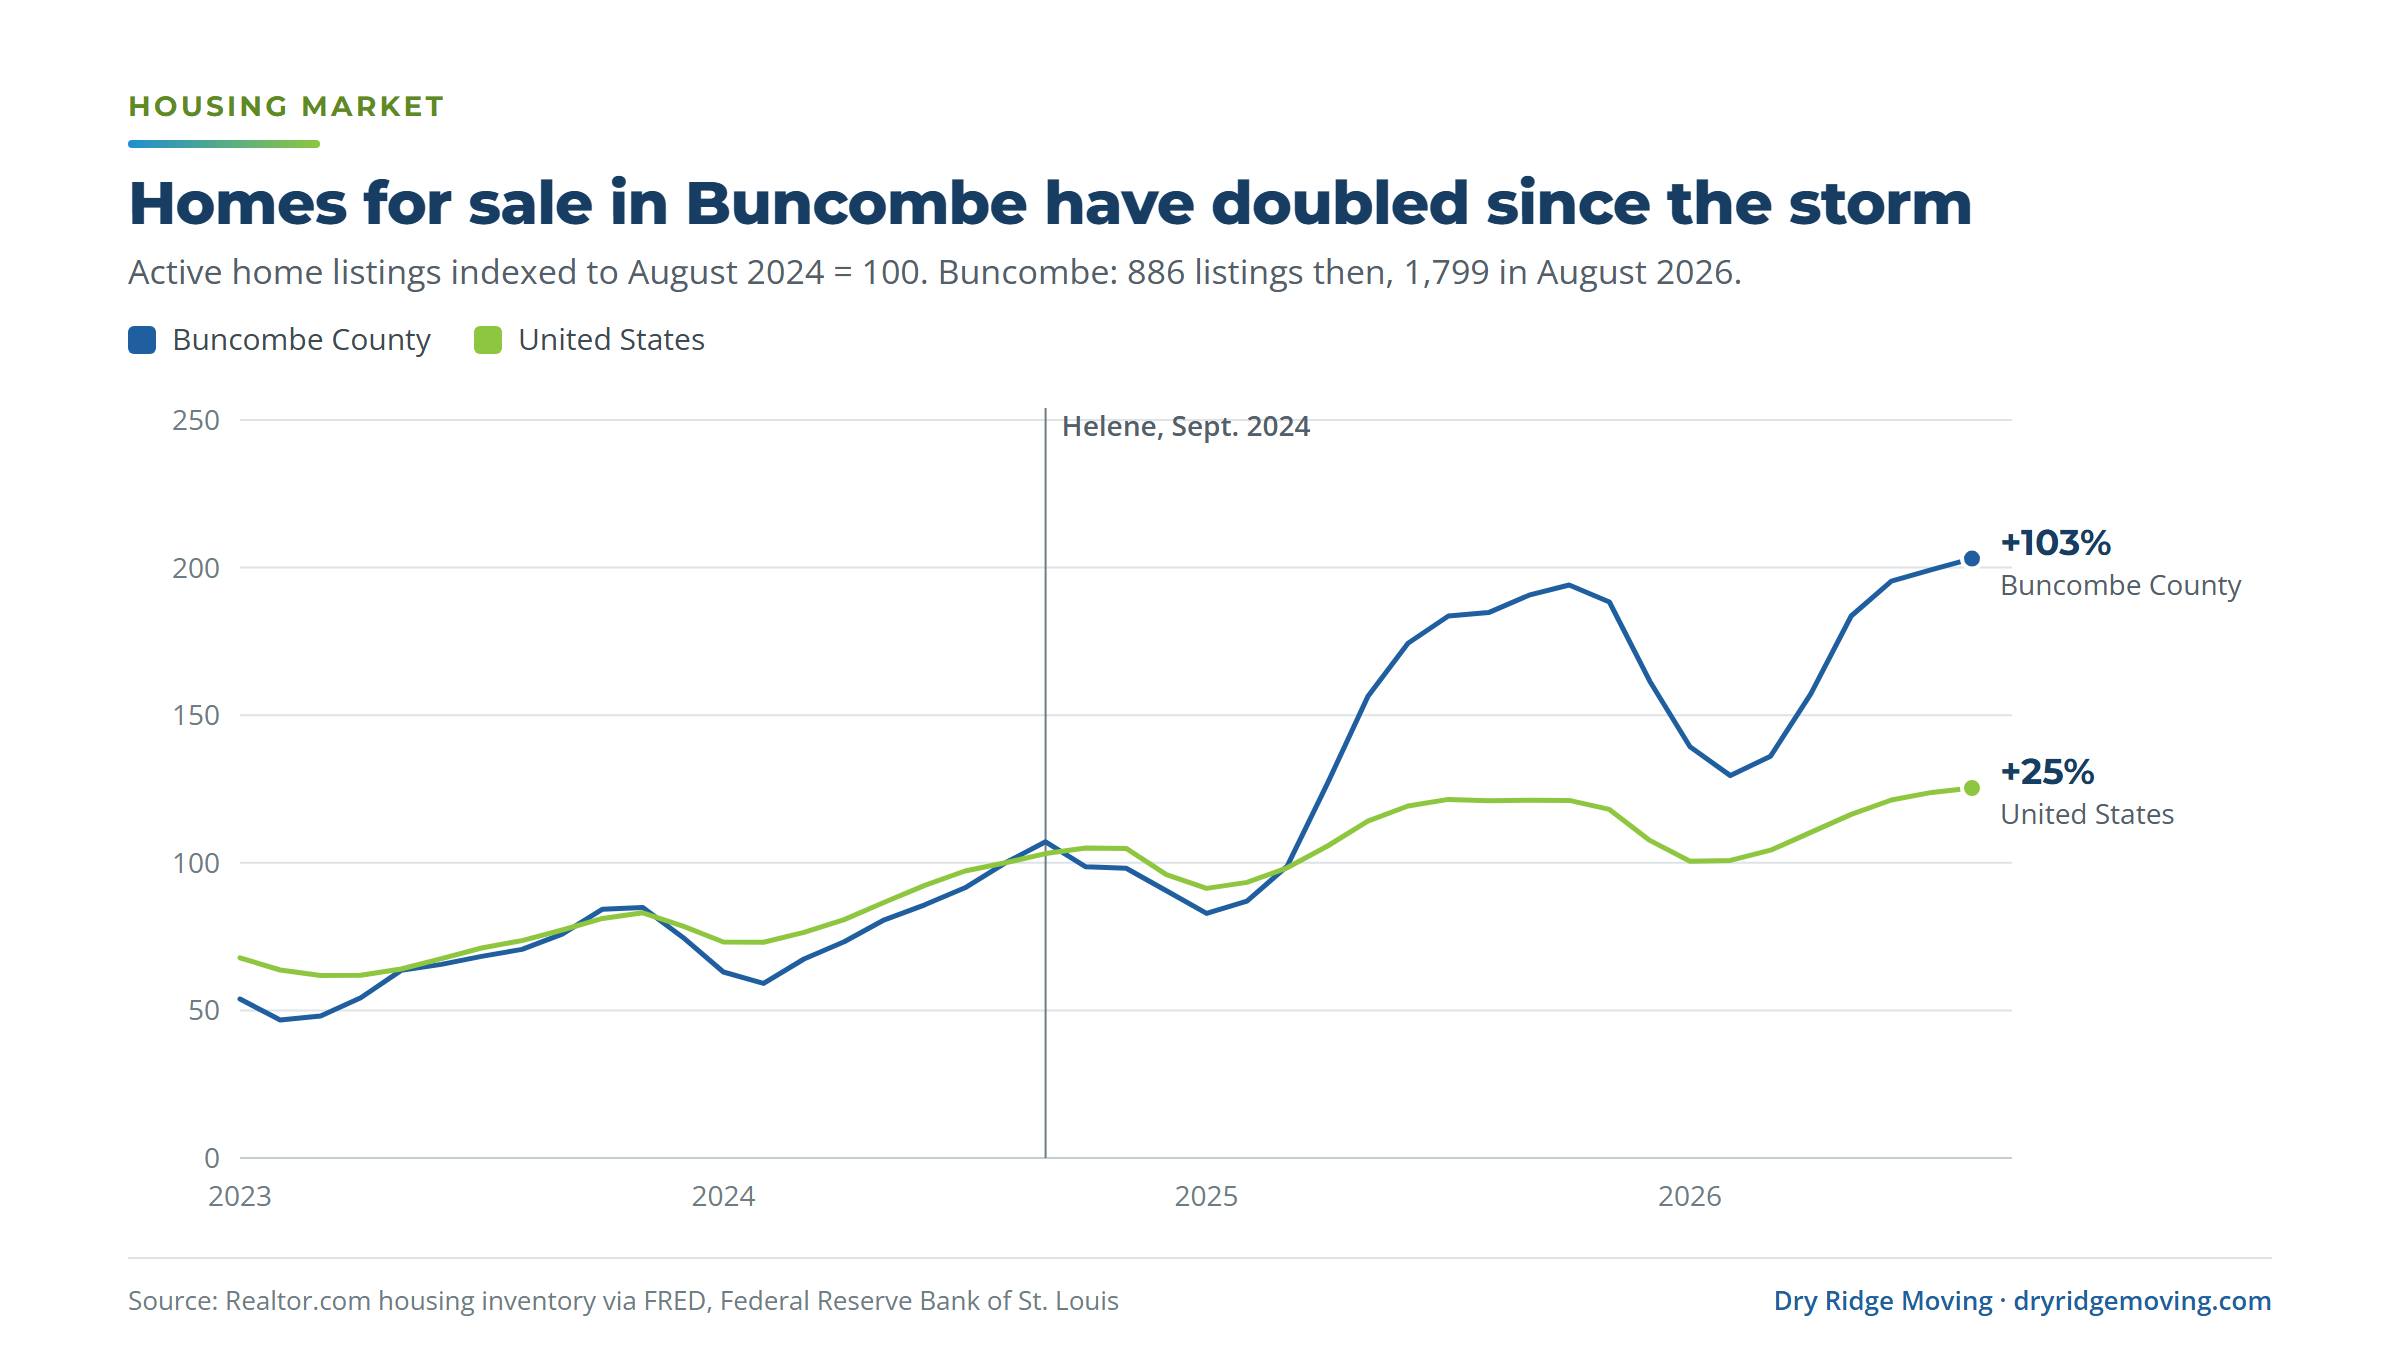
Active listings indexed to August 2024 = 100. Madison and Transylvania counties are not published in this series. Download chart (PNG)
Month | Buncombe County active listings | U.S. active listings |
|---|---|---|
2019-08 | 1,447 | 1,235,300 |
2023-08 | 626 | 669,766 |
2024-08 | 886 | 909,356 |
2024-10 | 874 | 955,135 |
2025-02 | 771 | 849,227 |
2025-08 | 1,637 | 1,100,371 |
2026-02 | 1,148 | 916,616 |
2026-08 | 1,799 | 1,140,035 |
Zillow’s typical home value in Buncombe County fell 5.6%, from about $480,200 in September 2024 to about $453,400 in July 2026. The Asheville metro fell 4.4%, the steepest decline among North Carolina metros in the nation’s 200 largest. Nationally, typical home values rose 1.1%. Rents were flat. Zillow’s observed rent index for the Asheville metro slipped 1.0% to about $1,686 a month, while U.S. rents rose 4.4%.
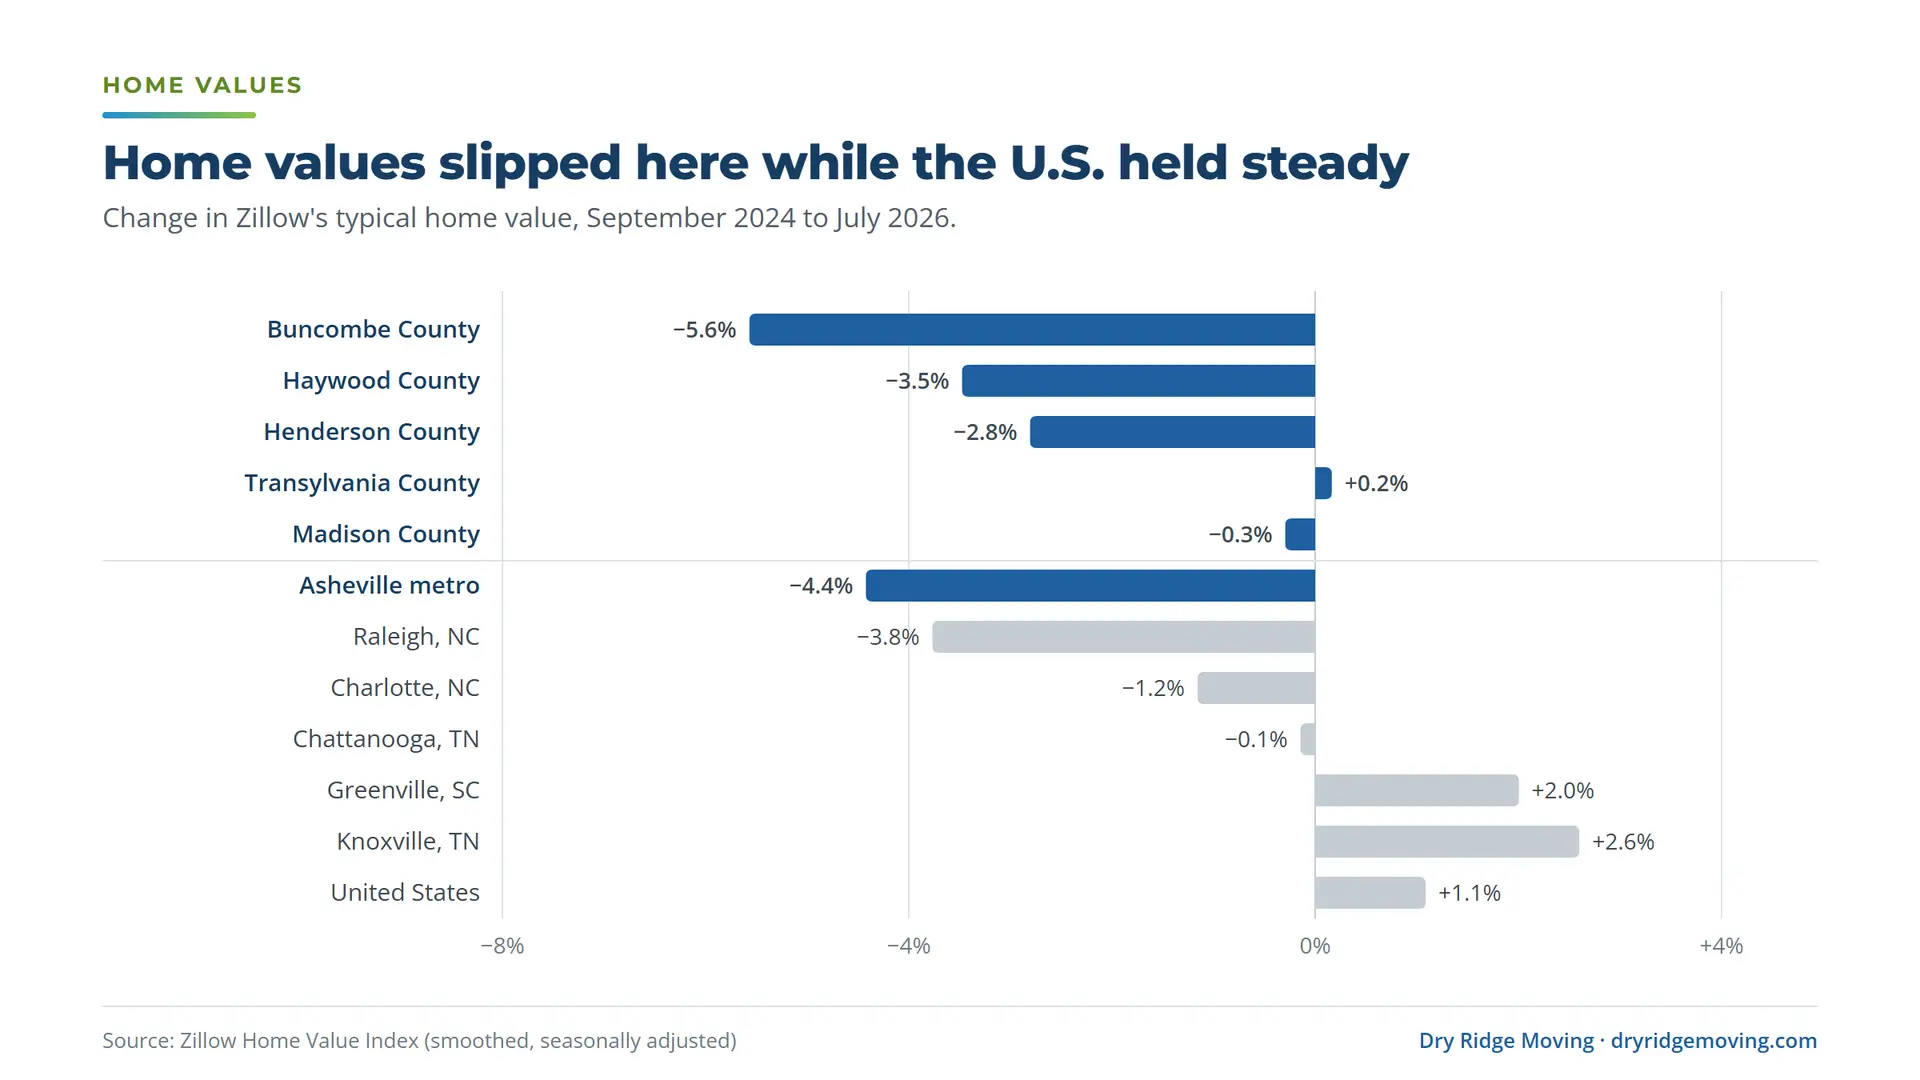
Zillow Home Value Index (typical home, smoothed and seasonally adjusted). County figures for smaller counties are based on fewer sales. Download chart (PNG)
Area | Sept. 2024 | July 2026 | Change |
|---|---|---|---|
Buncombe County | $480,162 | $453,427 | −5.6% |
Haywood County | $357,898 | $345,457 | −3.5% |
Henderson County | $441,575 | $429,185 | −2.8% |
Madison County | $398,954 | $397,782 | −0.3% |
Transylvania County | $474,457 | $475,231 | +0.2% |
Asheville metro | $445,937 | $426,217 | −4.4% |
Knoxville, TN | $358,590 | $367,915 | +2.6% |
Greenville, SC | $308,815 | $315,006 | +2.0% |
Chattanooga, TN | $326,515 | $326,041 | −0.1% |
Charlotte, NC | $393,292 | $388,736 | −1.2% |
Raleigh, NC | $454,611 | $437,484 | −3.8% |
United States | $367,776 | $371,774 | +1.1% |
Buncombe County’s unemployment rate jumped to 11.3% in October 2024, right after the storm, and was back to 3.4% by July 2026. But the labor force (people working or looking for work) is smaller. In July 2026 it counted 135,287 people, down 5.8% from July 2024. All five counties in our study area declined between 3.9% and 6.0%, compared with 1.2% statewide and a 0.3% gain nationally.
Note: 2026 county labor force figures from the Bureau of Labor Statistics are preliminary and will be revised. We compare July to July to avoid seasonal swings.
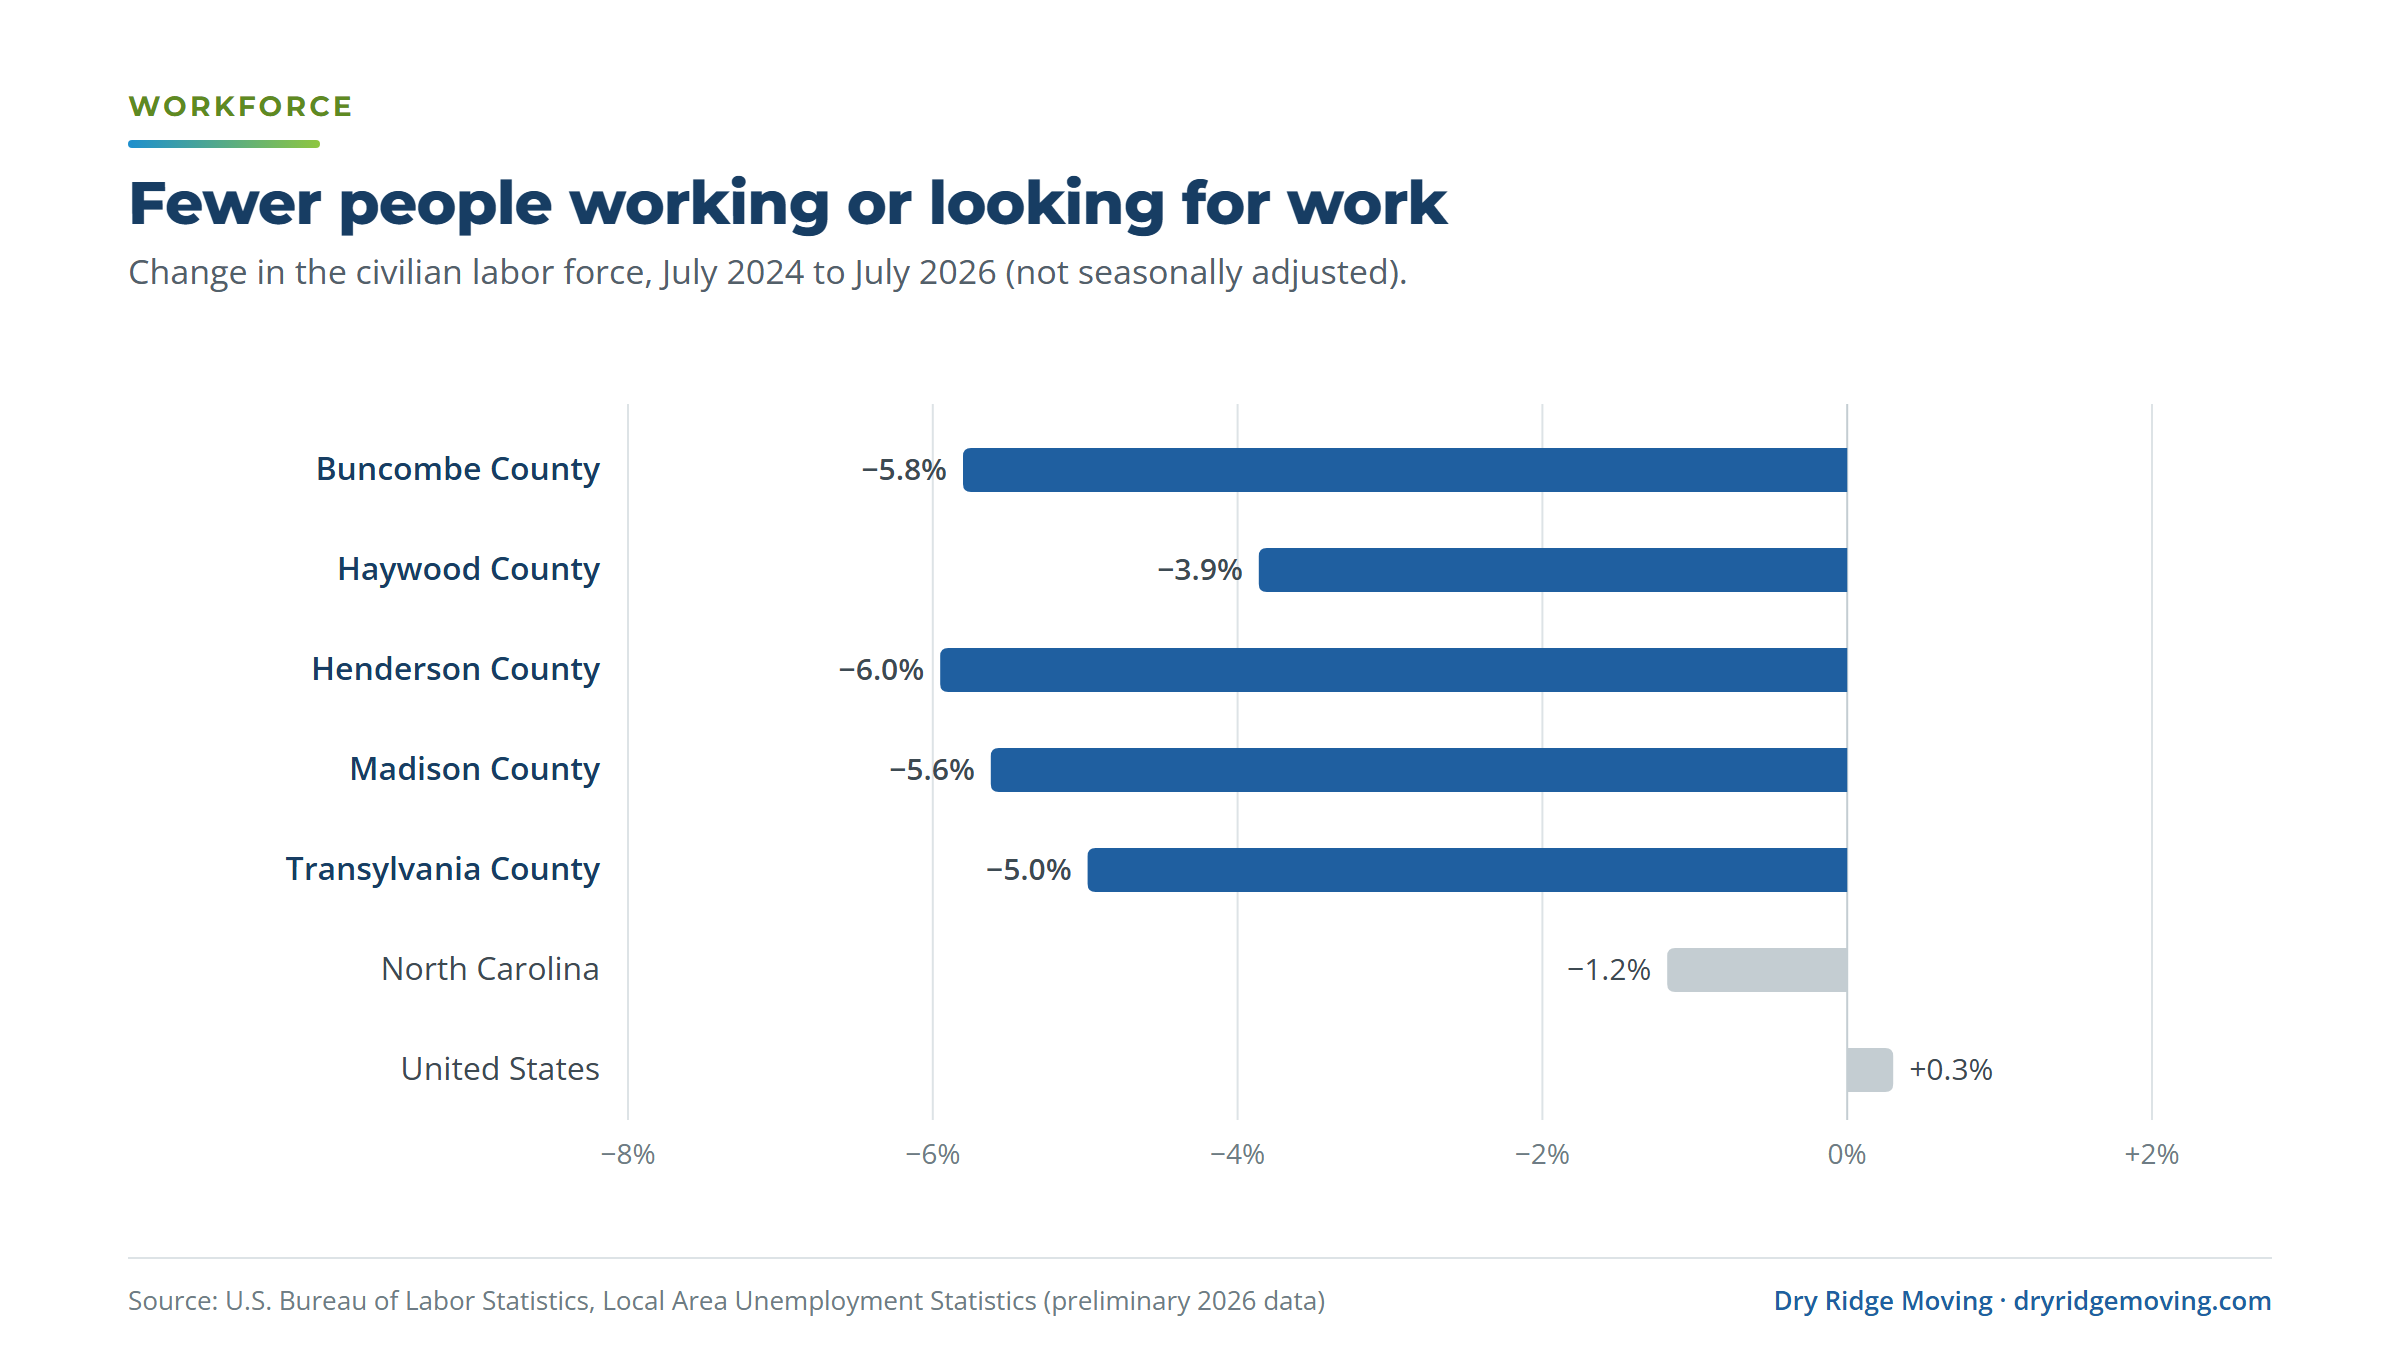
Civilian labor force, not seasonally adjusted. U.S. figures in thousands. Download chart (PNG)
Area | July 2024 | July 2026 | Change |
|---|---|---|---|
Buncombe County | 143,620 | 135,287 | −5.8% |
Haywood County | 29,010 | 27,890 | −3.9% |
Henderson County | 59,164 | 55,643 | −6.0% |
Madison County | 10,926 | 10,312 | −5.6% |
Transylvania County | 15,126 | 14,372 | −5.0% |
North Carolina | 5,300,665 | 5,238,034 | −1.2% |
United States (thousands) | 169,723 | 170,235 | +0.3% |
The IRS tracks where tax filers move each year. Its newest county-to-county data covers tax years 2022–23, before Helene, so it shows the pattern the storm interrupted. That year, Florida was the top out-of-state source of new households for Buncombe, Haywood, Henderson, Madison and Transylvania counties: 1,315 households moved in, and 336 moved back. Florida arrivals reported an average adjusted gross income of about $101,800.
South Carolina was the top destination for people leaving: 1,111 households moved there, mostly to Greenville and Spartanburg counties, while 654 came the other way. Households leaving for South Carolina averaged about $74,800 in income. In Buncombe County alone, 9,920 households moved in and 8,909 moved out. Arriving households averaged about $85,900 in adjusted gross income, compared with about $68,900 for departing households.
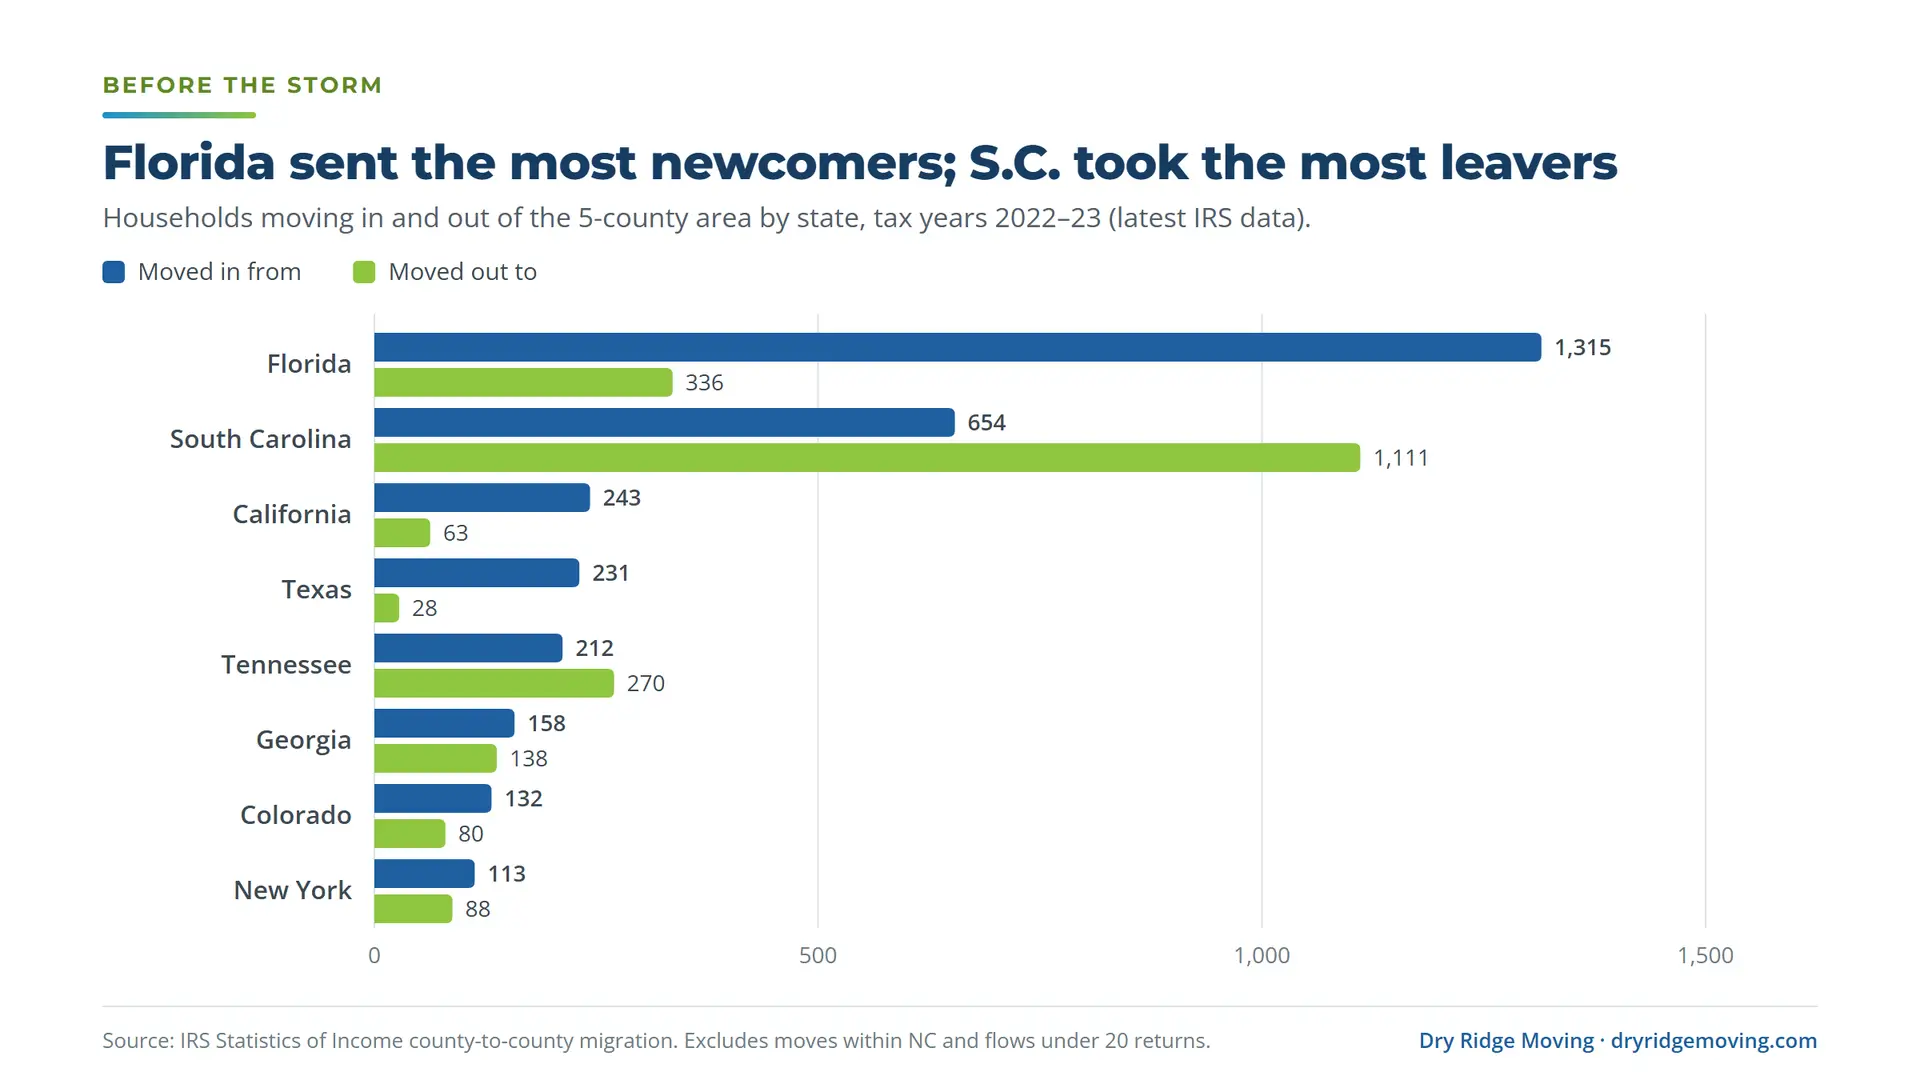
Out-of-state flows for the five-county area, tax years 2022–23. Moves between the five counties and within North Carolina are excluded. Download chart (PNG)
State | Households moved in | Households moved out | Net |
|---|---|---|---|
Florida | 1,315 | 336 | +979 |
South Carolina | 654 | 1,111 | −457 |
California | 243 | 63 | +180 |
Texas | 231 | 28 | +203 |
Tennessee | 212 | 270 | −58 |
Georgia | 158 | 138 | +20 |
Colorado | 132 | 80 | +52 |
New York | 113 | 88 | +25 |
Each county’s numbers from the study, in one place. Transylvania (17.2%) and Haywood (14.3%) counties also have a large share of homes held for seasonal or recreational use, compared with 3.9% statewide.
County | Pop. July 2025 | Change 2024–25 | Net domestic migration 2024–25 | Home value change* | Labor force change† | Seasonal-use homes |
|---|---|---|---|---|---|---|
Buncombe | 277,417 | −1,810 | −2,056 | −5.6% | −5.8% | 3.9% |
Haywood | 63,369 | +136 | +489 | −3.5% | −3.9% | 14.3% |
Henderson | 122,375 | +1,089 | +1,145 | −2.8% | −6.0% | 5.8% |
Madison | 22,553 | +87 | +177 | −0.3% | −5.6% | 9.3% |
Transylvania | 34,211 | +2 | +129 | +0.2% | −5.0% | 17.2% |
*Zillow typical home value, Sept. 2024 to July 2026. †BLS labor force, July 2024 to July 2026 (preliminary). Seasonal-use homes from ACS 5-year estimates, 2020–2024. Download the full table (CSV)
The numbers show a county where the storm changed who stayed and who arrived, at least for a year. They don’t show a region emptying out: Western North Carolina as a whole kept gaining residents, and unemployment has returned to pre-storm levels. The next Census estimates, due in spring 2027, will show whether Buncombe’s decline was a one-year disruption or the start of a longer shift.
Google Trends data suggests interest in “moving to Asheville” has picked up. Average monthly search interest from January through August 2026 was about 76% higher than the 2024 average. Searches for moving to nearby mountain metros grew faster: Knoxville (+150%), Greenville, S.C. (+161%) and Chattanooga (+198%). Google Trends is a relative, sampled index rather than a count of searches.
Study area. The study area is the five counties at the core of Dry Ridge Moving’s service area: Buncombe, Haywood, Henderson, Madison and Transylvania. “Western NC” refers to 23 mountain and foothill counties included in FEMA’s disaster declaration for Helene (DR-4827): Alleghany, Ashe, Avery, Buncombe, Burke, Caldwell, Cherokee, Clay, Graham, Haywood, Henderson, Jackson, McDowell, Macon, Madison, Mitchell, Polk, Rutherford, Swain, Transylvania, Watauga, Wilkes and Yancey.
Population and migration. U.S. Census Bureau county population estimates, Vintage 2025, which cover July 1 to July 1 of each year. Historical comparisons use the 2000–2010 intercensal estimates and Vintage 2020 estimates. The Census Bureau builds these estimates from administrative records such as tax returns, Medicare enrollment and Social Security data. They are revised every year, and people displaced temporarily may not be fully reflected. The national comparison includes the 620 counties with at least 100,000 residents in July 2024. For each county, we divided the change in net domestic migration between 2023–24 and 2024–25 by its July 2024 population.
Where movers came from. IRS Statistics of Income county-to-county migration data, tax years 2022–23 (the latest available). Households are counted as tax returns. Income is average adjusted gross income per return. The IRS combines flows of fewer than 20 returns, so state totals slightly undercount. Moves among the five study counties are excluded.
Housing. Zillow Home Value Index for the typical (middle-tier) home, smoothed and seasonally adjusted, and Zillow Observed Rent Index, September 2024 vs. July 2026 (the latest month available). Realtor.com active listings and median days on market through FRED, August 2024 vs. August 2026, comparing the same month to avoid seasonal effects.
Workforce. Bureau of Labor Statistics Local Area Unemployment Statistics, not seasonally adjusted, July 2024 vs. July 2026. 2026 figures are preliminary.
Housing profile. American Community Survey 5-year estimates, 2020–2024. ACS figures are survey estimates with published margins of error.
Limitations. These are estimates from different agencies with different time periods. They show what changed after Helene, but they cannot prove the storm alone caused each change. Remote work, interest rates and insurance costs also affect where people move and what homes cost.
Yes, according to the U.S. Census Bureau’s latest estimates. Buncombe County’s population fell by an estimated 1,810 people, or 0.6%, between July 2024 and July 2025, the first year that includes the storm. It is the county’s first annual decline in Census estimates going back to 2000 and the largest numeric loss of any North Carolina county that year.
Yes, but fewer. Across 23 Helene-declared counties in North Carolina’s mountains and foothills, net domestic migration stayed positive at about 4,180 people in the year after the storm, down 54.5% from 9,183 the year before. Henderson County still gained 1,089 residents overall.
Zillow’s typical home value in Buncombe County fell 5.6%, from about $480,200 in September 2024 to about $453,400 in July 2026, while the U.S. figure rose 1.1%. Active listings in Buncombe roughly doubled over the same stretch, from 886 in August 2024 to 1,799 in August 2026.
In the most recent IRS migration data (tax years 2022–23, before the storm), Florida was the top out-of-state source of new households for the five-county area, with 1,315 households moving in. South Carolina, led by Greenville and Spartanburg counties, was the top out-of-state destination, with 1,111 households moving out.
Yes. Journalists, researchers and local organizations are welcome to use the charts and data with credit to Dry Ridge Moving and a link to this page.
You’re welcome to share or republish these charts and findings. Please credit Dry Ridge Moving and link to this page. Media questions: 828-771-6953 Download the data (CSV)
Dry Ridge Moving is a moving company based in Asheville, North Carolina, serving Buncombe County and the surrounding mountain towns with local and long-distance moves. USDOT 1803573.